
One terminalfor the whole market.
From the index down to a single stock’s minute bars. Every view reads the same data pipeline.
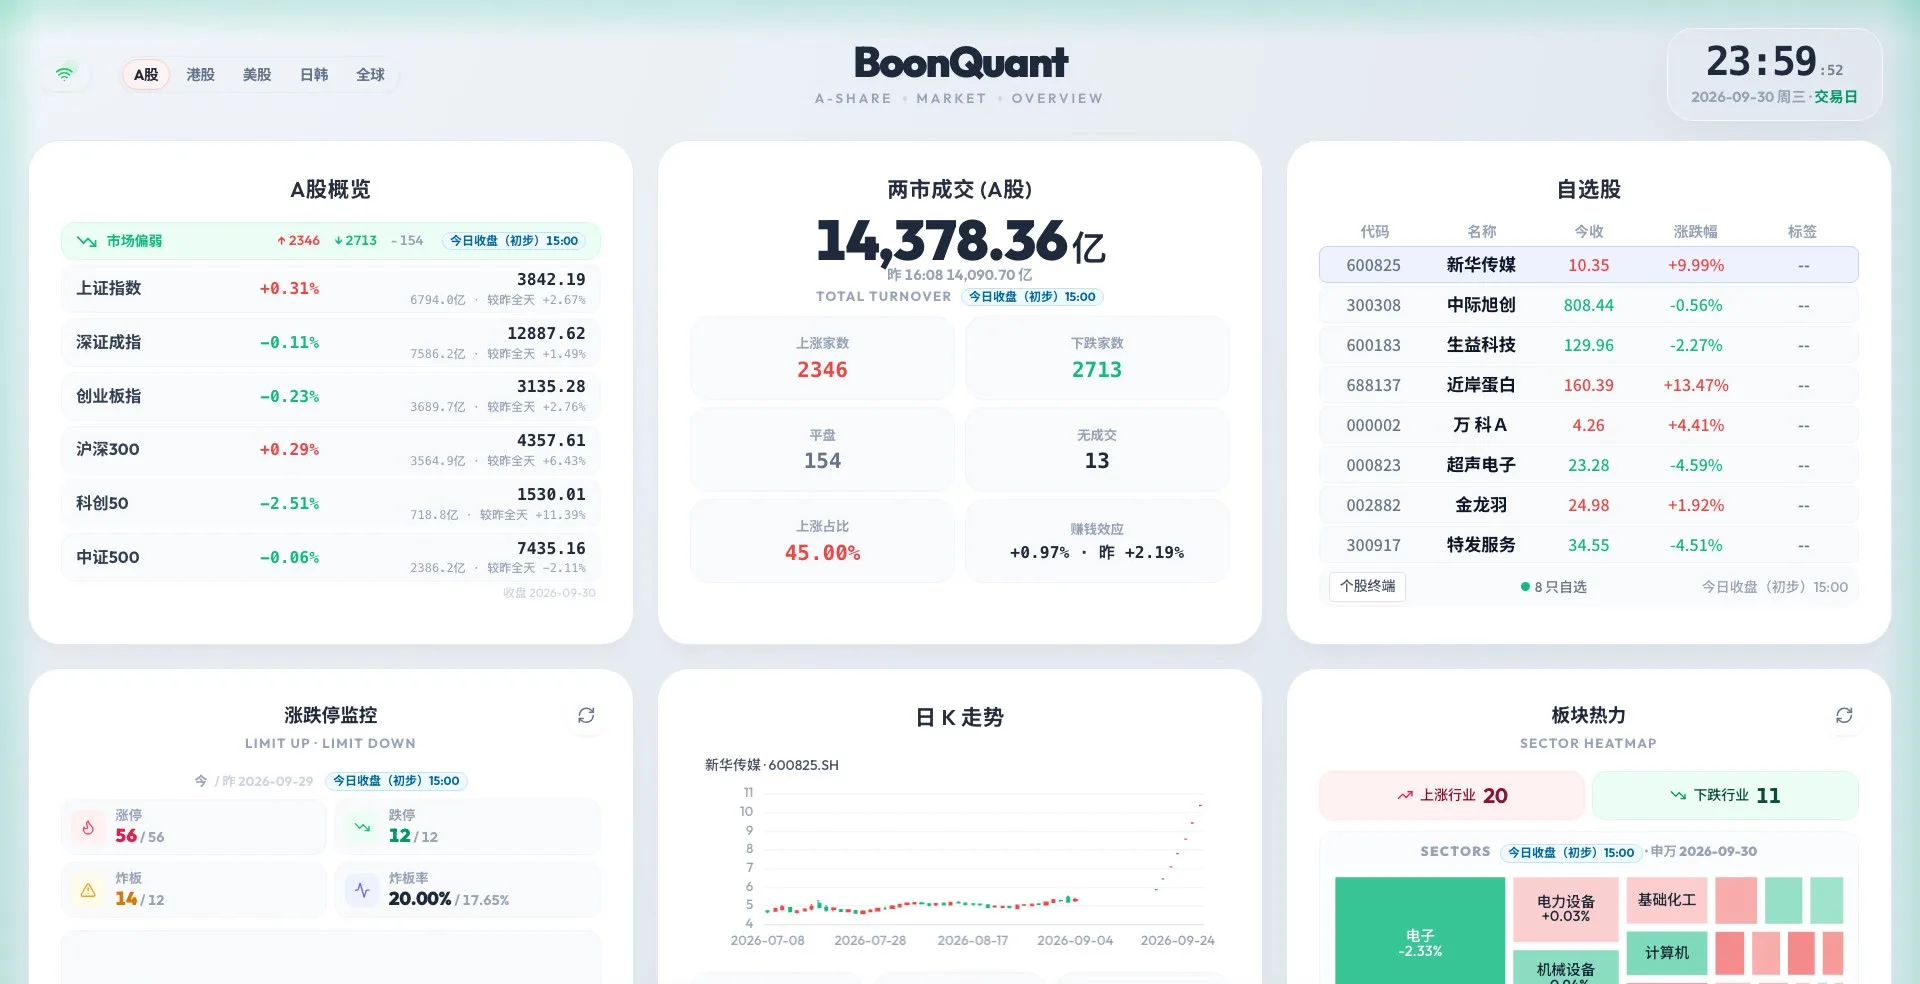
Start with the whole market.
Indices, turnover, breadth, limit-up and limit-down counts and a sector heat map, on one screen.
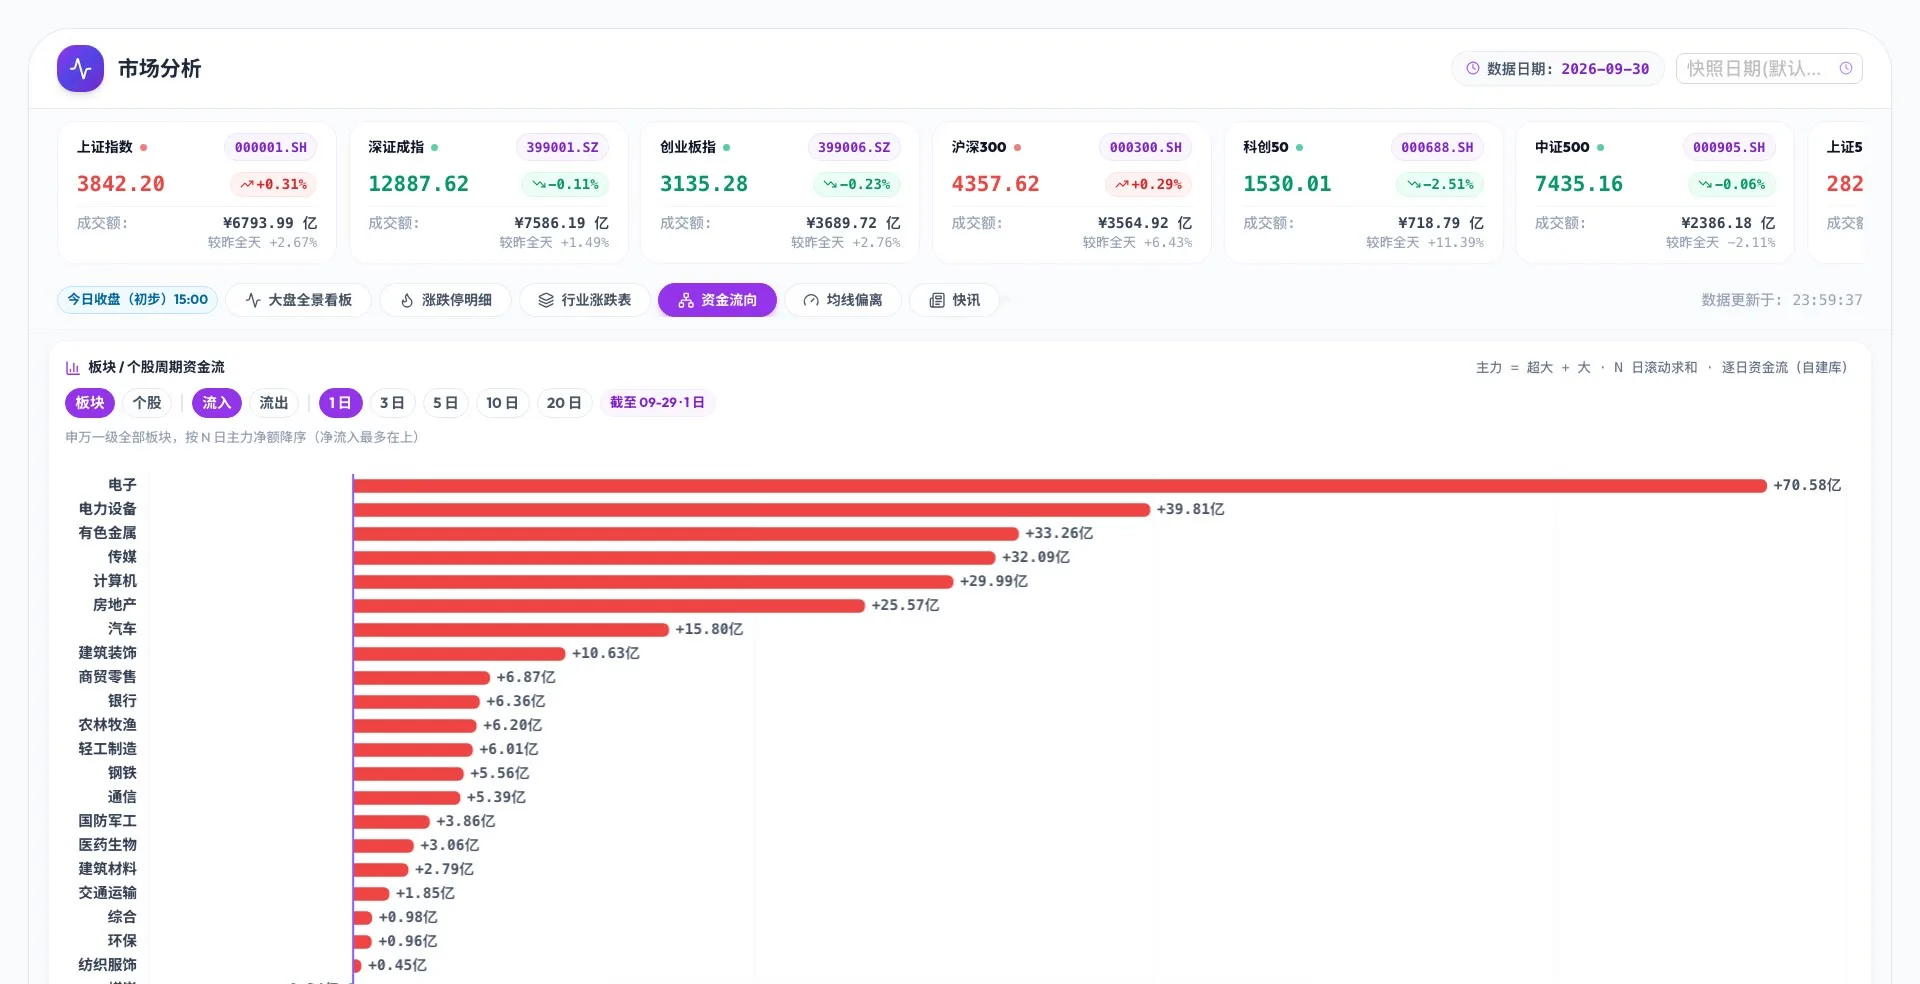
Follow the money by sector.
Shenwan level-1 industries ranked by net main-force inflow, over 1, 3, 5, 10 or 20 days.
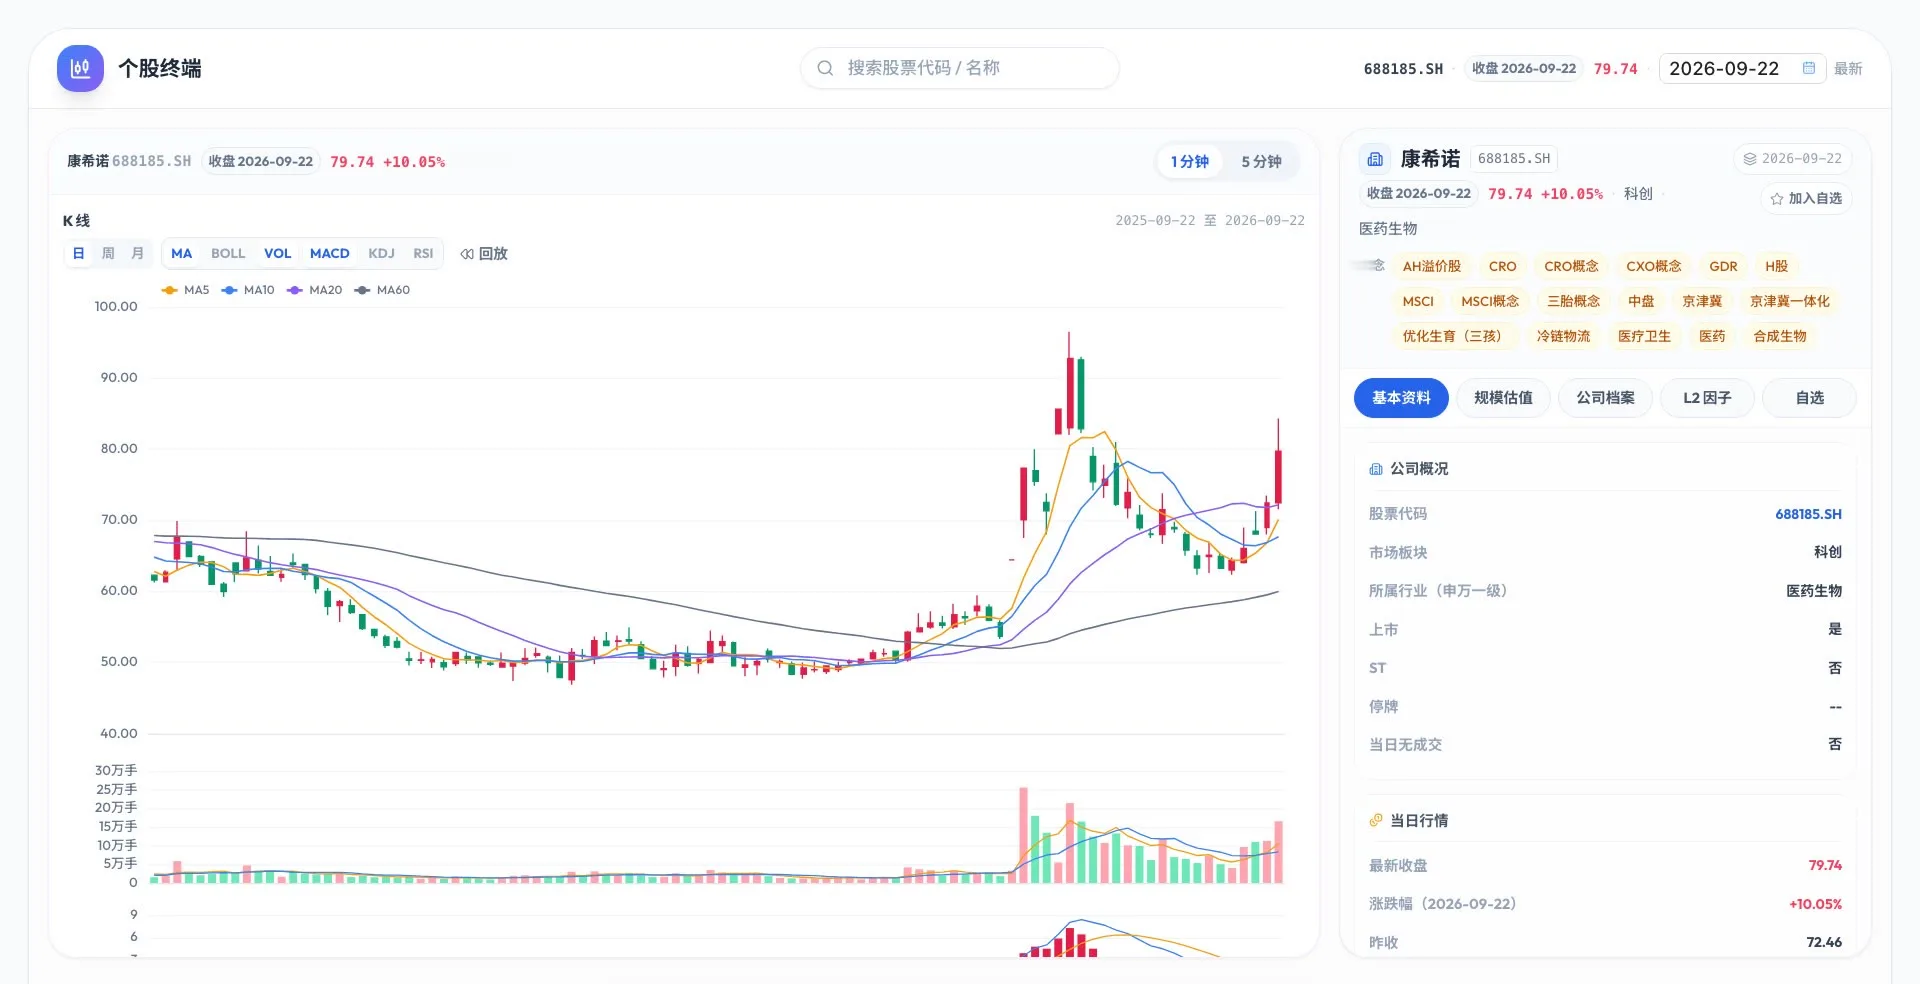
Then drill into a stock.
Daily to minute K-lines with indicator overlays, and the company profile with industry and concept tags beside the chart.
See which themes are heating up.
Concept themes ranked by attention, today’s limit-up count against yesterday’s, and leaders and relay candidates.
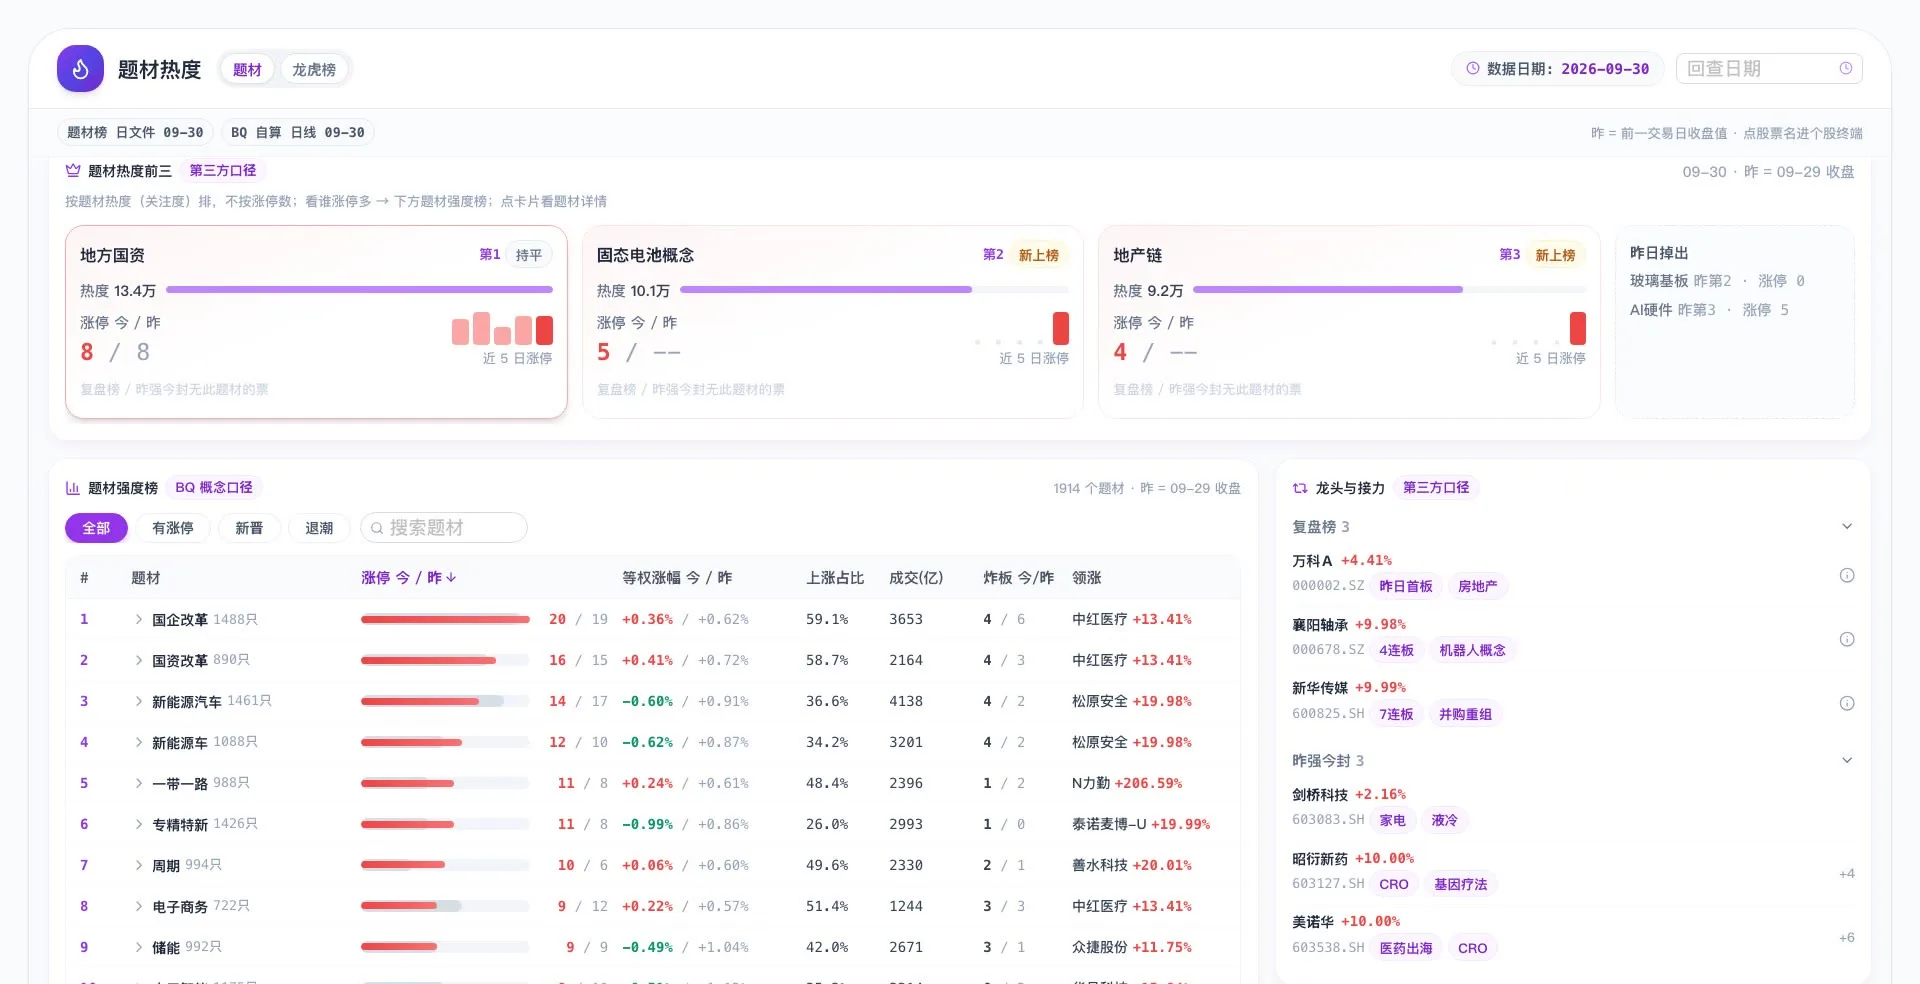
The interface is shown in Chinese.
And more, in the same terminal.
AI news interpretation
Breaking news is read against our own local stock data, so each item comes with the numbers behind it.
AI daily review
A written end-of-day market review, built from the same data the terminal shows.
Top-trader list
Exchange-disclosed trading-seat records for stocks with unusual moves.
Limit-up and limit-down
Daily counts, board streaks, failed boards and per-stock detail.
Sector strength
Shenwan level-1 heat map, money flow and strength rankings.
Backtest replay
Step through a backtest day by day, with the equity curve and the trades side by side.
Built for traders, tested every day.
The terminal is the tool we use ourselves. Research services are planned within 6–12 months.